Home PLS Microcontroller Trace Support
PLS

Microcontroller Trace Support

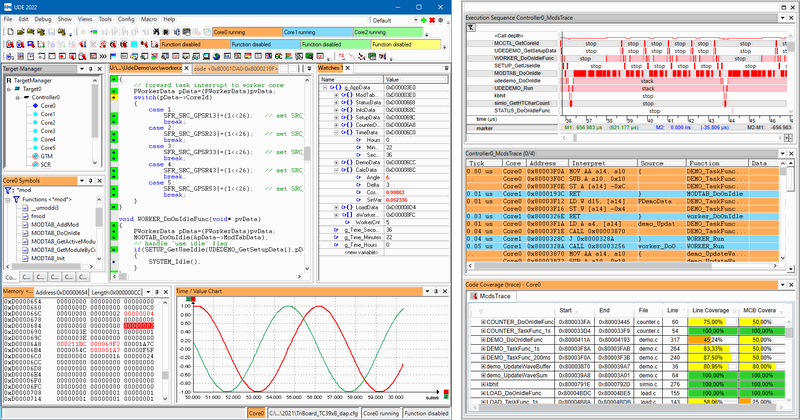
Microcontroller Trace Support delivers real-time visibility into what the processor is doing before and after critical events. It turns live trace streams into clear charts and reports for function profiling, code coverage, execution sequences, and variable access, so you can pinpoint faults and optimize behavior faster..

  • Detail
  • Special Features
  • Specification

Deep debugging needs a close connection to the CPU. Microcontroller Trace Support captures instruction and data activity so you can reconstruct how code executed, which paths were taken, and how long functions ran. You can profile execution time per function, prove coverage for quality and safety work, inspect call hierarchies with timing, and watch variable changes over time.
Results are presented as readable charts and numeric tables, making it easy to share findings with your team and to guide fixes or performance improvements.

  • Real-time trace for accurate before/after event analysis

  • Unified views for profiling, coverage, call sequences, and memory changes

  • Tick-aware code tracing for time-based insights where required

  • Chart and table outputs ready for reports and reviews

  • Works alongside UDE® Universal Debug Engine workflows

  • Product Name: Microcontroller Trace Support

  • Trace Use Cases:

    • Function Profiling: Measure execution time per function

    • Code Coverage: Validate executed code regions

    • Execution Sequence: Visualize call hierarchy and timing sequence

    • Variable Access: Track memory changes over time

  • Trace Requirements By Mode:

    • Function Profiling: Code trace with tick information (subroutine only possible)

    • Code Coverage: Code trace without tick information

    • Execution Sequence: Code trace with tick information

    • Variable Access: Data trace with tick information

  • Outputs:

    • Function Profiling: Graphical charts and reports

    • Code Coverage: Graphical charts and reports

    • Execution Sequence: Graphical charts

    • Variable Access: Graphical charts