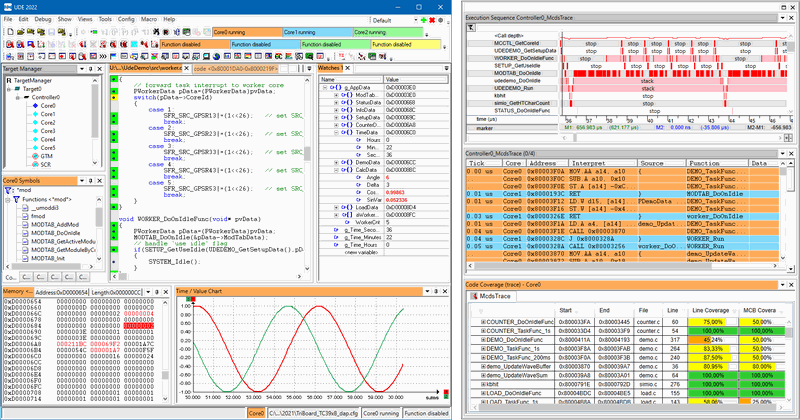
The UDE Multi-Core Workbench keeps multi-core debugging straightforward. You pick the cores and functional units you want to control, group them if needed, and drive them with shared start, stop, and step commands. This removes guesswork when coordinating complex interactions between CPUs, lockstep units, or accelerators.
Setup stays simple even with different toolchains. The built-in multi-core loader distributes binaries and attaches the right symbols per core, so you can compile modules independently and still debug them together. Visibility Groups and core-specific coloring keep windows organized, while time-based graphs let you watch variables from multiple cores in one place. For safety and performance work, you get graphical code coverage to support ISO 26262 evidence, plus profiling from instruction-pointer trace data. The Workbench reads common trace sources and on-chip emulators, then presents a single, synchronized view for event correlation and root-cause analysis.