Home PLS Universal Emulation Configurator
PLS

Universal Emulation Configurator

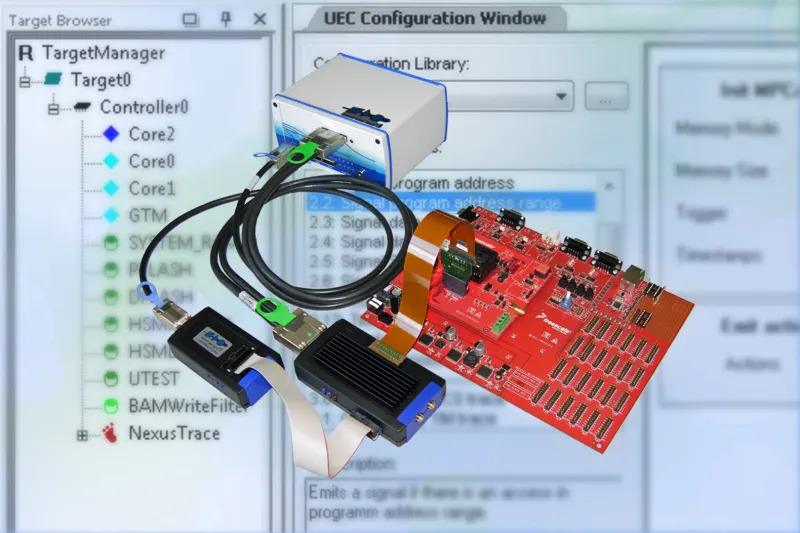
Universal Emulation Configurator (UEC) is a device-independent tool that lets you define advanced trace and measurement tasks for on-chip emulators through a clean, graphical workflow. Build anything from simple recordings to complex state-machine driven scenarios without dealing with low-level register details..

  • Detail
  • Special Features
  • Specification

UEC turns complex trace configuration into a clear visual task. You describe what to observe and when to record, then UEC generates the right settings for the target emulator. This approach saves time and reduces setup errors on modern multi-core SoCs. You can start with simple instruction or data traces, and scale to advanced sequences that use state machines, timers, and counters to capture only what matters. UEC also prepares targeted collections for code coverage and profiling, so you can prove execution and analyze performance with less noise.
Because UEC is device-independent, teams can reuse methods across AURIX, TriCore, PowerArchitecture, and CoreSight-based devices while keeping a consistent workflow inside the UDE® environment.

  • Drag-and-drop library of configuration blocks for fast setup

  • Graphic composition of trace tasks with states, conditions, and triggers

  • Device-independent workflow that hides target-specific complexity

  • Parallel trace across multiple clients like cores and buses

  • Built-in support for timing, profiling, and code coverage preparation

  • Cross-trigger and run-control integration where supported

  • Works with UDE® for streamlined setup and repeatable results

  • Product Name: Universal Emulation Configurator (UEC)

  • Workflow: Graphic composition of trace tasks using reusable blocks, states, and conditions

  • Core Capabilities: Instruction trace, data trace, timing capture, profiling setup, filters with timers and counters, trigger-based run control

  • Outputs: Trace setups for use in UDE® with support for profiling and code coverage analysis

Platform Support

  • Infineon AURIX™ TC3xxED (MCDS):

    • Instruction and data trace for cores and buses

    • Parallel trace of multiple clients

    • Exact execution timing and profiling

    • State machines, filters with timers and counters

    • Run-control on MCDS triggers

    • GTM and peripheral trace

    • Performance counter trace

  • AURIX™ miniMCDS:

    • Instruction and data trace for one core

    • Exact execution timing and profiling

    • State machines, filters with timers and counters

    • Run-control on MCDS triggers

    • GTM trace

  • PowerArchitecture™ NEXUS SPU (NXP and ST):

    • Instruction and data trace for cores and buses

    • Parallel clients with cross-trigger via SPU

    • Exact execution timing and profiling

    • State machines and filtered capture

    • GTM trace and NXMC client trace

  • ST Stellar (Arm CoreSight™ for Cortex-R52 and Cortex-M4):

    • Instruction and data trace for cores

    • NoC data transaction trace

    • Parallel clients, timing, profiling, and filtered capture

    • GTM trace

  • Infineon TriCore™ TC17xxED (MCDS):

    • Instruction and data trace for cores and buses

    • Parallel clients, timing, profiling

    • State machines, filters, run-control on MCDS triggers

    • Performance counter trace

  • XC2000ED Family (MCDS, incl. XC2080ED, XC2090ED):

    • Instruction and data trace

    • Exact execution timing and profiling

    • State machines, filters, run-control on MCDS triggers

    • Performance counter trace

    • Profiling limits depend on available trace memory