
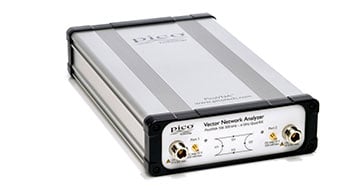
PicoVNA 106
Precision You Can Trust
NABL-Accredited Calibration | Available on Request
The PicoVNA 106 is a professional two-port USB vector network analyser designed for RF, microwave, antenna, cable, filter and component testing from 300 kHz to 6 GHz. Its four-receiver architecture measures S11, S21, S12 and S22 without an internal transfer switch. It provides up to 118 dB dynamic range, fast dual-port measurements, built-in bias tees, time-domain analysis, de-embedding, advanced calibration and automated test support through PicoVNA software and PicoSDK..
- Detail
- Special Features
- Specification
The PicoVNA 106 Vector Network Analyser is designed for engineers, laboratories, manufacturers, service teams, educational institutions and system integrators that require accurate RF network measurements in a compact PC-controlled instrument.
It combines a swept RF source, directional bridges, four measurement receivers and two test ports in one portable unit. This architecture enables direct forward and reverse network measurements without relying on a mechanical or electronic transfer switch between the ports.
The PicoVNA 106 provides:
- 300 kHz to 6 GHz frequency coverage
- Two 50 Ω test ports
- Direct measurement of all four S-parameters
- Quad-RX four-receiver architecture
- Up to 118 dB dynamic range
- Resolution bandwidth from 10 Hz to 140 kHz
- Fast dual-port measurement
- Frequency-domain and time-domain analysis
- Two built-in bias tees
- SOLT, TRL, TRM and E-Cal calibration support
- Reference-plane extension and de-embedding
- USB control
- PicoVNA software
- SCPI and API automation
The instrument is suitable for laboratory development, field installation, production testing, education and integration into automated RF test systems.
300 kHz to 6 GHz Frequency Range
The PicoVNA 106 covers frequencies from 300 kHz to 6 GHz, allowing one instrument to test low-frequency networks and microwave devices.
Suitable devices include:
- Antennas
- RF filters
- Amplifiers
- Attenuators
- Cables
- Connectors
- Couplers
- Splitters
- PCB transmission lines
- Matching networks
- Resonators
- RF components
- Wireless modules
- RFID systems
- Cellular and Wi-Fi components
The broad frequency range supports applications involving common communication bands, including sub-GHz systems, GNSS, cellular, Wi-Fi, Bluetooth and other RF technologies operating below 6 GHz.
The instrument provides a frequency setting resolution of 10 Hz and specified frequency accuracy of up to ±10 ppm under the stated environmental conditions.
Full Two-Port S-Parameter Measurement
The PicoVNA 106 directly measures:
- S11 input reflection coefficient
- S21 forward transmission
- S12 reverse transmission
- S22 output reflection coefficient
These measurements can be used to calculate and display:
- Return loss
- Insertion loss
- Gain
- Phase
- VSWR
- Impedance
- Admittance
- Group delay
- Real and imaginary components
- Smith chart data
- Polar data
Direct access to all four S-parameters makes the instrument suitable for complete characterisation of two-port passive and active devices.
Typical measurements include:
- Filter passband and stopband response
- Amplifier gain and input/output matching
- Cable insertion loss
- Antenna return loss
- Connector discontinuities
- Phase delay
- Isolation between ports
- Component impedance
- Network stability parameters
Quad-RX Four-Receiver Architecture
The PicoVNA 106 uses a four-receiver architecture.
Instead of switching a limited set of receivers between measurement directions, the instrument measures the incident and reflected signals at both ports using dedicated receiver paths.
This design helps:
- Reduce switching delays
- Minimise uncorrectable transfer-switch errors
- Improve reverse measurement reliability
- Increase measurement speed
- Maintain stable phase relationships
- Support direct S11, S21, S12 and S22 acquisition
The architecture is especially useful for automated testing where repeatability and acquisition time affect production throughput.
Up to 118 dB Dynamic Range
The PicoVNA 106 provides up to approximately 118 dB dynamic range at 10 Hz resolution bandwidth.
High dynamic range supports measurements of:
- High-rejection filters
- Low-level leakage paths
- Port isolation
- Stopband attenuation
- Shielding effectiveness
- Crosstalk
- Directional couplers
- High-loss cables
- Weak transmission paths
Dynamic range depends on test frequency, source level, resolution bandwidth, calibration and measurement configuration.
The instrument also provides low RMS trace noise, helping users obtain stable magnitude and phase measurements across demanding RF devices.
Fast S-Parameter Measurement
The PicoVNA 106 can acquire all four S-parameters at a frequency point in approximately 182 µs under specified conditions.
Its measurement performance includes:
- More than 5,000 dual-port S-parameter measurements per second
- More than 10,000 S11 and S21 measurements per second
- A 201-point two-port Touchstone file in under approximately 38 ms
- Two single-port files in under approximately 20 ms
Fast measurement is useful for:
- Production-line testing
- Automated device screening
- Component binning
- Tuning filters and matching networks
- Monitoring changing devices
- Multi-device test systems
- Repeated design verification
Actual sweep time depends on frequency span, resolution bandwidth, point count, averaging, markers and host computer performance.
Adjustable Resolution Bandwidth
The measurement resolution bandwidth can be adjusted up to a maximum of approximately 140 kHz.
A narrower resolution bandwidth provides:
- Lower measurement noise
- Greater dynamic range
- Improved weak-signal visibility
- More stable measurements
A wider resolution bandwidth provides:
- Faster sweeps
- Quicker tuning
- Faster automated tests
- Improved production throughput
Users can select the appropriate balance between speed, noise and dynamic range for each measurement.
Adjustable Test-Port Output Power
The PicoVNA 106 provides adjustable test signal power according to frequency.
Published source-level ranges include approximately:
- −20 dBm to −3 dBm below 10 MHz
- −20 dBm to +6 dBm from 10 MHz to 4 GHz
- −20 dBm to +3 dBm above 4 GHz
Power can be adjusted in 0.1 dB steps.
Variable output power supports testing of:
- Sensitive receiver inputs
- Passive filters
- Low-noise amplifiers
- Active RF components
- Devices with compression limits
- Components requiring level-dependent characterisation
The maximum usable source power varies with frequency and measurement configuration.
Built-In Bias Tees
The PicoVNA 106 includes built-in bias tees on both measurement ports.
Each bias tee supports:
- DC voltage up to 15 V
- DC current up to 250 mA
- Bias injection through front-panel SMB connectors
The bias tees allow DC power to be applied to active devices while RF measurements are performed through the main test ports.
Typical applications include:
- Low-noise amplifier testing
- Active antenna measurement
- RF transistor evaluation
- Bias-dependent filter testing
- Powered RF modules
- Variable attenuators
- Active matching circuits
The stated voltage and current limits must not be exceeded.
Frequency-Domain Measurements
PicoVNA software can display measurement results in several frequency-domain formats.
Available plot types include:
- Log magnitude
- Linear magnitude
- Phase
- Real
- Imaginary
- Group delay
- VSWR
- Smith chart
- Polar chart
Multiple live and stored traces can be shown in configurable viewports.
This helps engineers compare:
- Measured and simulated response
- Before-and-after tuning results
- Different device samples
- Temperature-dependent behaviour
- Reference and current measurements
- Forward and reverse transmission
- Multiple S-parameters
Time-Domain Analysis
Frequency-domain measurements can be transformed into the time domain to help locate discontinuities along a cable, connector or transmission structure.
Time-domain functions support:
- Low-pass step response
- Low-pass impulse response
- Band-pass impulse response
- Distance-to-fault analysis
- Cable discontinuity location
- Connector reflection analysis
- PCB transmission-line inspection
- Feed-network troubleshooting
Windowing options help control transform artefacts and measurement resolution.
Time-domain analysis is useful for identifying:
- Damaged cable sections
- Poor connectors
- Impedance changes
- PCB trace discontinuities
- Incorrect terminations
- Multiple reflections
Reference-Plane Extension
Reference-plane extension allows the measurement reference point to be moved electrically from the calibration plane to another position.
It can compensate for:
- Test cable delay
- Connector length
- Fixture feed lines
- PCB launch sections
- Known transmission paths
Independent reference-plane adjustments can be applied to Port 1 and Port 2.
This helps engineers view the device response at the intended DUT terminals rather than at the ends of the test cables.
Fixture De-Embedding
PicoVNA software supports embedding and de-embedding of networks described by Touchstone data.
De-embedding can remove the measured or simulated effects of:
- Test fixtures
- Cables
- Adaptors
- Connectors
- PCB launches
- Feed networks
- Matching sections
This is especially useful when a device cannot be connected directly to the calibrated VNA ports.
The software can apply separate networks to each port and combine de-embedding with reference-plane extension.
Calibration Methods
Accurate VNA measurement requires calibration at the measurement reference plane.
The PicoVNA platform supports calibration methods including:
- SOLT
- Eight-term calibration
- Twelve-term calibration
- Known-through calibration
- Unknown-through calibration
- TRL
- TRM
- Automated E-Cal
These calibration methods support:
- Insertable devices
- Non-insertable devices
- Male-to-female devices
- Female-to-female devices
- PCB-mounted devices
- Fixtures with non-coaxial standards
PicoVNA software provides guided calibration workflows to reduce setup errors.
Automated E-Cal Support
Pico automated E-Cal modules can reduce the time and manual connection steps required for calibration.
E-Cal can help:
- Improve repeatability
- Reduce operator errors
- Speed up production setup
- Simplify training
- Reduce repeated connection cycles
- Support automated test systems
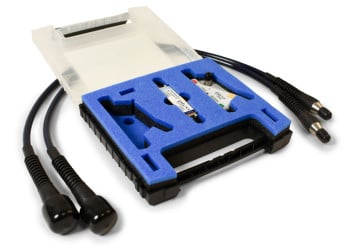
Manual SMA and premium 3.5 mm calibration kits are also available.
Pico calibration kits are individually characterised, and their measurement data can be loaded into the software to improve calibration accuracy.
P1dB Compression Measurement
The PicoVNA platform includes tools for measuring the output level at which an amplifier or active device begins to compress.
P1dB testing helps evaluate:
- Amplifier linearity
- Gain compression
- Maximum useful output level
- Active device performance
- RF module behaviour
The software changes the test power and evaluates gain variation to determine the compression point.
The device under test must remain within the VNA port power limits.
AM-to-PM Conversion Measurement
AM-to-PM analysis measures the change in output phase as input amplitude varies.
This is useful for:
- RF amplifier characterisation
- Communication transmitter design
- Radar systems
- Phase-sensitive applications
- Nonlinear device testing
AM-to-PM behaviour can contribute to modulation distortion and spectral degradation in communication systems.
Stand-Alone Signal Generator Utility
The internal swept RF source can also be controlled as a continuous-wave signal generator within its available frequency and output-level range.
This supports:
- RF stimulus generation
- Device troubleshooting
- Receiver testing
- Educational demonstrations
- External measurement setups
- System alignment
The PicoVNA 106 should not be presented as a replacement for a specialised low-noise signal generator where advanced modulation or high output power is required.
PicoVNA Software
PicoVNA software provides the main user interface for instrument control and analysis.
Features include:
- Frequency and time-domain displays
- Cartesian, Smith and polar plots
- Multiple configurable viewports
- Live and memory traces
- Markers and reference markers
- Calibration management
- Time-domain transformation
- Reference-plane extension
- Embedding and de-embedding
- Touchstone import and export
- CSV export
- Session save and recall
- Offline data analysis
- Remote control
- Multiple instrument operation
PicoVNA 5 supports Windows, macOS and Linux, while PicoVNA 3 remains supported for some legacy and specialised measurement functions.
Touchstone and Data Export
Measured results can be saved in common formats including:
- Touchstone S1P
- Touchstone S2P
- CSV
- Magnitude-angle format
- Log magnitude and phase
- Real-imaginary format
Touchstone files can be imported into:
- RF simulation software
- PCB design tools
- Microwave circuit simulators
- Signal-integrity software
- Custom analysis programs
Direct data export simplifies comparison between measured and simulated device behaviour.
PicoSDK, API and SCPI Control
The PicoVNA 106 supports automated control through:
- PicoVNA API
- SCPI commands
- PicoSDK examples
- Binary measurement broadcasts
Supported programming environments include:
- Python
- C
- C++
- C#
- MATLAB
- LabVIEW
Automation can be used for:
- Production testing
- Repeated device characterisation
- Pass/fail testing
- Remote laboratories
- OEM systems
- Multi-instrument control
- Custom test interfaces
- Automated report generation
API control provides direct access to the instrument, while SCPI allows external applications to interact with PicoVNA software.
Compact USB-Controlled Design
The PicoVNA 106 is a compact, half-rack RF instrument controlled by an external computer.
Its PC-based architecture provides:
- Large display support
- Direct file storage
- Easy data sharing
- Flexible software layouts
- Remote operation
- Automated test integration
- Reduced instrument footprint
The instrument connects using USB 2.0 and is compatible with USB 3.0 ports.
A separate DC power supply is required for operation.
Applications
The PicoVNA 106 is suitable for:
- Antenna matching and tuning
- RF filter testing
- Amplifier characterisation
- Cable and connector analysis
- PCB transmission-line testing
- Component S-parameter measurement
- Return-loss and VSWR testing
- Group-delay measurement
- RF module validation
- Wireless product development
- RFID and IoT testing
- Cellular and Wi-Fi component testing
- Production-line RF testing
- Field installation and maintenance
- Network metrology education
- Automated test equipment
- Research and development
- OEM system integration
300 kHz to 6 GHz Measurement Range
Supports RF and microwave testing for:
- Antennas
- Filters
- Amplifiers
- Cables
- Connectors
- Wireless modules
- PCB networks
Complete Two-Port VNA
Directly measures:
- S11
- S21
- S12
- S22
Quad-RX Architecture
Four receivers provide:
- Direct forward and reverse acquisition
- Reduced switching errors
- Fast measurement
- Stable phase performance
Up to 118 dB Dynamic Range
Supports:
- High-rejection filter measurement
- Isolation testing
- Crosstalk analysis
- Low-level transmission measurement
High-Speed Measurement
Performance includes:
- More than 5,000 dual-port S-parameters per second
- More than 10,000 S11 and S21 measurements per second
- 201-point S2P files in under approximately 38 ms
Built-In Bias Tees
Both ports support:
- Up to 15 V DC
- Up to 250 mA
- Active device biasing
Advanced Calibration
Supported methods include:
- SOLT
- Eight-term
- Twelve-term
- Unknown through
- TRL
- TRM
- Automated E-Cal
Time-Domain Analysis
Supports:
- Cable fault location
- Connector discontinuity analysis
- Transmission-line inspection
- Step and impulse response
De-Embedding and Reference-Plane Control
Allows users to remove:
- Cables
- Adaptors
- Fixtures
- PCB launches
- Feed networks
Automation Support
Compatible with:
- Python
- C and C++
- C#
- MATLAB
- LabVIEW
- SCPI
- PicoSDK
Core Technical Specifications
| Specification | PicoVNA 106 |
|---|---|
| Product type | Two-port USB vector network analyser |
| Frequency range | 300 kHz to 6 GHz |
| Test ports | 2 |
| Port impedance | 50 Ω |
| Port connectors | SMA female |
| Measured parameters | S11, S21, S12 and S22 |
| Receiver architecture | Quad-RX, four receivers |
| Maximum dynamic range | Approximately 118 dB at 10 Hz RBW |
| Maximum resolution bandwidth | 140 kHz |
| Frequency setting resolution | 10 Hz |
| Frequency accuracy | ±10 ppm maximum under specified conditions |
| Sweep points | 51 to 10,001 |
| Time-domain points | 512 to 4,096 |
| Computer interface | USB 2.0 |
| Software | PicoVNA |
| Automated control | API, SCPI and PicoSDK |
Signal Source Specifications
| Specification | Details |
|---|---|
| Source frequency range | 300 kHz to 6 GHz |
| Output level below 10 MHz | Approximately −20 dBm to −3 dBm |
| Output level, 10 MHz to 4 GHz | Approximately −20 dBm to +6 dBm |
| Output level above 4 GHz | Approximately −20 dBm to +3 dBm |
| Level resolution | 0.1 dB |
| Level accuracy | Approximately ±1.5 dB |
| Frequency resolution | 10 Hz |
| Harmonics | −20 dBc maximum at specified source levels |
| Non-harmonic spurious | Approximately −40 dBc typical |
| CW source operation | Supported |
Measurement Performance
| Specification | Details |
|---|---|
| All four S-parameters per point | Approximately 182 µs |
| Dual-port S-parameter rate | More than 5,000 measurements per second |
| S11 plus S21 rate | More than 10,000 measurements per second |
| 201-point S2P acquisition | Less than approximately 38 ms |
| Dynamic range | Up to approximately 118 dB |
| Maximum RBW | 140 kHz |
| Minimum RBW | 10 Hz |
| Trace noise | Resolution-bandwidth dependent |
Port and Bias Specifications
| Specification | Details |
|---|---|
| RF port type | Two SMA female |
| Nominal impedance | 50 Ω |
| Normal operating input limit | +10 dBm |
| Damage-protection limit | +20 dBm or 1 V peak |
| Built-in bias tees | Two |
| Maximum bias voltage | 15 V DC |
| Maximum bias current | 250 mA per specified circuit |
| Bias connectors | SMB male |
Calibration Support
| Calibration Method | Availability |
|---|---|
| One-port calibration | Supported |
| SOLT | Supported |
| Eight-term calibration | Supported |
| Twelve-term calibration | Supported |
| Known through | Supported |
| Unknown through | Supported |
| TRL | Supported |
| TRM | Supported |
| Automated E-Cal | Supported with optional kit |
| Manual calibration kits | Available separately |
| Reference-plane extension | Supported |
| Fixture de-embedding | Supported |
Software and Analysis
| Function | Capability |
|---|---|
| Frequency-domain plots | Log magnitude, linear magnitude, phase, real and imaginary |
| Smith chart | Supported |
| Polar plot | Supported |
| VSWR | Supported |
| Group delay | Supported |
| Time-domain transform | Supported |
| Markers | Supported |
| Multiple live traces | Supported |
| Memory traces | Supported |
| Touchstone import/export | Supported |
| CSV export | Supported |
| Session save and recall | Supported |
| Offline data analysis | Supported |
| Multi-instrument control | Supported |
| SCPI control | Supported |
| Direct API control | Supported |
Physical and Environmental Specifications
| Specification | Details |
|---|---|
| Power input | 12 V to 15 V DC |
| Maximum peak current | Approximately 1.85 A |
| Maximum power | Approximately 22 W |
| USB connection | USB 2.0, USB 3.0 compatible |
| Operating temperature | 5°C to 40°C |
| Storage temperature | −20°C to 50°C |
| Maximum altitude | 2,000 m |
| Intended environment | Dry indoor or controlled outdoor use |